
The AGGREGATE function in Excel is one of the most powerful yet underutilized tools that can revolutionize how you handle data calculations.
Whether you’re a beginner just starting with spreadsheets or an advanced user looking to streamline your workflow, understanding this versatile function will significantly enhance your Excel capabilities.
Excel’s AGGREGATE function serves as a Swiss Army knife for data analysis, combining multiple statistical functions into one comprehensive tool.
This remarkable feature allows you to perform various calculations while automatically handling errors and hidden rows, making your data analysis more robust and reliable.
Table of Contents
📊 Understanding the Basics of Excel’s AGGREGATE Function
The AGGREGATE function in Excel belongs to the Math & Trigonometry category and was introduced in Excel 2010.
What makes this function special is its ability to perform 19 different calculations using a single formula structure.
Unlike traditional functions that might break when encountering errors or hidden data, the AGGREGATE function in Excel intelligently handles these situations.
When you use the AGGREGATE function in Excel, you’re essentially accessing a collection of statistical functions including AVERAGE, COUNT, MAX, MIN, SUM, and many others.
The beauty lies in its flexibility and error-handling capabilities that traditional functions lack.
The basic syntax follows this pattern:
=AGGREGATE(function_num, options, array, [k])This structure allows you to specify which calculation to perform, how to handle errors and hidden values, and which data range to analyze.
The function_num parameter determines the type of calculation, ranging from 1 to 19, each representing different statistical operations.

🎯 Function Numbers and Their Corresponding Operations
To master the AGGREGATE function in Excel, it’s important to clearly understand how its function numbers work.
Each number corresponds to a specific statistical operation, giving you access to various analytical tools within a single function.
Check out this detailed list of all available function numbers:
| Function Number | Operation | Equivalent Function | Description |
|---|---|---|---|
| 1 | AVERAGE | AVERAGE | Calculates arithmetic mean |
| 2 | COUNT | COUNT | Counts numeric values |
| 3 | COUNTA | COUNTA | Counts non-empty cells |
| 4 | MAX | MAX | Finds maximum value |
| 5 | MIN | MIN | Finds minimum value |
| 6 | PRODUCT | PRODUCT | Multiplies all numbers |
| 7 | STDEV.S | STDEV.S | Sample standard deviation |
| 8 | STDEV.P | STDEV.P | Population standard deviation |
| 9 | SUM | SUM | Adds all numbers |
| 10 | VAR.S | VAR.S | Sample variance |
| 11 | VAR.P | VAR.P | Population variance |
| 12 | MEDIAN | MEDIAN | Middle value |
| 13 | MODE.SNGL | MODE.SNGL | Most frequent value |
| 14 | LARGE | LARGE | Kth largest value |
| 15 | SMALL | SMALL | Kth smallest value |
| 16 | PERCENTILE.INC | PERCENTILE.INC | Percentile (inclusive) |
| 17 | QUARTILE.INC | QUARTILE.INC | Quartile (inclusive) |
| 18 | PERCENTILE.EXC | PERCENTILE.EXC | Percentile (exclusive) |
| 19 | QUARTILE.EXC | QUARTILE.EXC | Quartile (exclusive) |
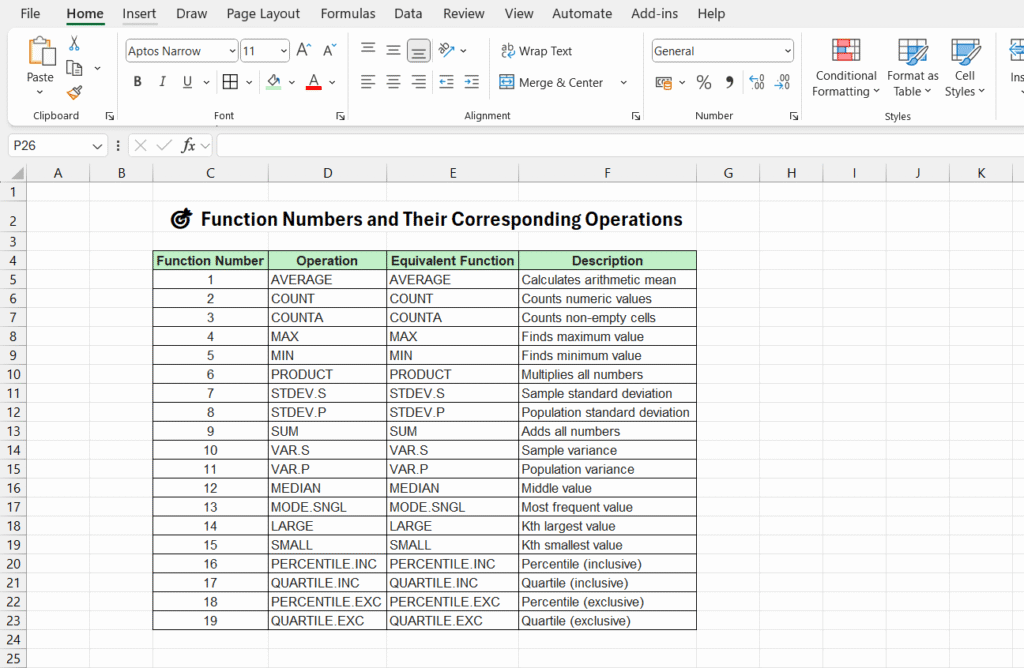
Each function number opens up different analytical possibilities, making the AGGREGATE function in Excel incredibly versatile for various data scenarios.
⚙️ Options Parameter: Controlling Data Handling
The options parameter in the AGGREGATE function in Excel determines how the function handles error values and hidden rows.
This feature sets it apart from traditional Excel functions and makes it particularly useful for dynamic datasets.
The options parameter accepts values from 0 to 7, each providing different error-handling behaviors:
- Option 0: (or if left blank): Skips any nested SUBTOTAL or AGGREGATE functions
- Option 1: Skips hidden rows as well as any nested SUBTOTAL or AGGREGATE functions
- Option 2: Ignores error values, nested SUBTOTAL and AGGREGATE functions
- Option 3: Ignores hidden rows, error values, and any nested SUBTOTAL or AGGREGATE functions.
- Option 4: Ignores nothing
- Option 5: Ignores hidden rows
- Option 6: Ignores error values
- Option 7: Ignores hidden rows and error values
This flexibility makes the AGGREGATE function in Excel extremely valuable when working with filtered data or datasets containing errors that would typically break other functions.
🚀 Practical Applications and Real-World Examples
Let’s explore how the AGGREGATE function in Excel works in practical scenarios.
Consider a sales dataset where you need to calculate various statistics while ignoring any error values or hidden rows.
For calculating the average of visible cells while ignoring errors:
=AGGREGATE(1, 6, A2:A100)To find the maximum value while ignoring hidden rows:
=AGGREGATE(4, 5, B2:B100)For finding the second-largest value in a dataset:
=AGGREGATE(14, 6, C2:C100, 2)These examples demonstrate how the AGGREGATE function in Excel simplifies complex calculations that would otherwise require multiple functions and error-handling techniques.
When working with filtered data, the AGGREGATE function in Excel becomes invaluable. Traditional functions like SUM or AVERAGE include hidden rows in their calculations, but AGGREGATE respects your filter settings and calculates only visible data.
📈 Advanced Techniques and Best Practices
Mastering the AGGREGATE function in Excel involves understanding advanced techniques that can significantly improve your data analysis workflow.
One powerful approach is combining multiple AGGREGATE functions to create comprehensive analytical dashboards.
For dynamic reporting, you can use the AGGREGATE function in Excel with named ranges and data validation.
This creates interactive reports where users can select different calculation types from dropdown menus, and the results update automatically.
Consider creating a template where users can choose between different statistical measures. By linking the function_num parameter to a cell containing data validation, you enable dynamic switching between calculations without rewriting formulas.
Another advanced technique involves using the AGGREGATE function in Excel within array formulas for complex multi-criteria calculations.
This approach allows you to perform sophisticated analyses that would be difficult or impossible with traditional functions.
For businesses using TECH TELLENT solutions, integrating AGGREGATE functions into automated reporting systems can streamline data processing workflows and reduce manual calculation errors.
🔧 Troubleshooting Common Issues
While the AGGREGATE function in Excel is robust, users sometimes encounter challenges that require troubleshooting.
Understanding these common issues helps ensure smooth implementation in your spreadsheets.
One frequent problem occurs when users expect the AGGREGATE function in Excel to handle text values the same way as numeric values.
Remember that functions 1, 6-11, and 16-19 require numeric data and will produce errors with text inputs.
Another common issue involves misunderstanding the options parameter.
Users sometimes wonder why their AGGREGATE function in Excel isn’t ignoring hidden rows, only to discover they’re using option 0 instead of option 5 or 7.
Performance can become a concern when using the AGGREGATE function in Excel with very large datasets.
While generally efficient, complex calculations on millions of cells might require optimization through range reduction or alternative approaches.
Microsoft’s official docs explain that the AGGREGATE function works well in most Excel scenarios, but knowing its limits can save you from unexpected results.
💡 Integration with Other Excel Features
AGGREGATE function in Excel becomes more powerful when paired with other built-in features.
Integration with pivot tables, conditional formatting, and dynamic charts creates comprehensive analytical solutions.
When building dashboard systems, the AGGREGATE function in Excel serves as the calculation engine while other features handle visualization and user interaction.
This combination creates professional-grade reporting tools within standard Excel workbooks.
Data validation becomes particularly powerful when paired with the AGGREGATE function in Excel.
Users can create dropdown menus that change calculation types dynamically, making spreadsheets more interactive and user-friendly.
Conditional formatting can reference AGGREGATE outputs to visually mark data points crossing defined thresholds.
For example, highlighting values that fall below the 25th percentile or above the 75th percentile becomes straightforward with AGGREGATE calculations.
🎓 Learning Path and Skill Development
Developing proficiency with the AGGREGATE function in Excel requires structured practice and gradual skill building.
Start with basic calculations like SUM and AVERAGE before progressing to more complex statistical functions.
Practice scenarios should include datasets with errors, hidden rows, and filtered data to fully appreciate the AGGREGATE function’s capabilities.
Creating sample datasets with these characteristics helps build confidence and understanding.
Advanced users should explore combining the AGGREGATE function in Excel with other advanced features like Power Query, Power Pivot, and VBA macros.
These combinations unlock enterprise-level analytical capabilities within Excel.
Regular practice with real-world datasets reinforces learning and reveals practical applications that textbook examples might miss.
The AGGREGATE function in Excel becomes more intuitive with hands-on experience across different data scenarios.
❓Frequently Asked Questions.
What is the main advantage of using AGGREGATE function over traditional Excel functions?
The AGGREGATE function in Excel automatically handles errors and hidden rows, unlike traditional functions that might break or include unwanted data in calculations. It also combines 19 different statistical functions into one versatile tool.Can AGGREGATE function work with text data?
Some AGGREGATE functions work with text (like COUNTA), but most statistical functions (1, 6-11, 16-19) require numeric data. Functions 2-5, 12-15 can handle both numeric and text data depending on the operation.How does AGGREGATE function handle filtered data?
When you use options 1, 3, 5, or 7, the AGGREGATE function automatically ignores hidden rows, making it perfect for calculations on filtered datasets where you only want results from visible data.Is AGGREGATE function available in all Excel versions?
The AGGREGATE function was introduced in Excel 2010, so it’s available in Excel 2010, 2013, 2016, 2019, Excel for Microsoft 365, and Excel for Mac 2011 and later versions.Can I use AGGREGATE function in array formulas?
Yes, the AGGREGATE function works excellently in array formulas, allowing for complex multi-criteria calculations and dynamic range processing that traditional functions cannot easily accomplish.🎯 Conclusion: Mastering Excel’s Most Versatile Function
Excel’s AGGREGATE function takes spreadsheet use to the next level with its versatile and dependable data analysis features.
By combining 19 different statistical functions into one powerful tool, it eliminates the need to remember multiple function names while providing superior error handling and data filtering capabilities.
Throughout this comprehensive guide, we’ve explored how the AGGREGATE function in Excel can transform your approach to data analysis.
From basic calculations like sums and averages to advanced statistical measures like percentiles and quartiles, this function adapts to virtually any analytical requirement you might encounter.
The real advantage of using the AGGREGATE function in Excel comes from understanding its flexibility.
The options parameter gives you precise control over how errors and hidden data are handled, while the function numbers provide access to a complete statistical toolkit.
This combination makes it an indispensable tool for anyone working with data in Excel.
Whether you’re creating dynamic dashboards, analyzing filtered datasets, or building robust reporting systems, the AGGREGATE function in Excel should be at the center of your analytical arsenal.
Its ability to handle real-world data challenges like errors, hidden rows, and filtered ranges makes it far superior to traditional functions in many scenarios.
As you continue developing your Excel skills, remember that mastering the AGGREGATE function in Excel opens doors to more sophisticated data analysis techniques.
Start with simple applications and gradually incorporate more advanced features as your confidence grows.
With practice and persistence, this powerful function will become second nature, significantly enhancing your productivity and analytical capabilities.