
Automate Excel reports to transform your workflow and eliminate hours of manual data processing.
If you’re tired of spending countless hours copying, pasting, and formatting the same reports every week or month, you’re not alone.
Learning how to automate Excel reports can revolutionize your productivity and free up valuable time for more strategic tasks the help you for Automate excel reports.
Excel automation has become essential for businesses of all sizes, from small startups to large corporations.
Whether you’re creating weekly sales summaries, monthly financial statements, or quarterly performance dashboards, of automate excel reports can streamline these repetitive tasks and reduce human error significantly.
Table of Contents
Why You Should Automate Excel Reports
Manually preparing reports consumes significant time and frequently results in errors. When you automate Excel reports, you create a system that works consistently and accurately every time.
This approach offers numerous benefits that can transform how you handle data analysis and reporting.
First, automation saves tremendous amounts of time. Instead of spending hours each week formatting cells, creating charts, and copying data from various sources, automated systems can complete these tasks in minutes.
This time savings allows you to focus on analyzing results rather than preparing reports.
Second, automated reports reduce human error significantly. Manual data entry often leads to typos, formula mistakes, and formatting inconsistencies.
When you automate Excel reports, you eliminate these common errors and ensure data accuracy across all your reporting processes.
Third, automate excel reports ensures consistency in your reporting format. Every report follows the same structure, uses identical formatting, and presents information in a standardized way.
This consistency makes it easier for stakeholders to understand and compare Automate excel reports over time.
Getting Started with Excel Report Automation
Before diving into advanced automation techniques, you need to understand the foundation.
To successfully automate Excel reports, start by organizing your data sources and identifying repetitive tasks that consume most of your time.
Begin by documenting your current reporting process. List every step you take to create your reports, from data collection to final formatting.
This guide allows you to see which tasks can be automated and which still need manual work.
Next, clean and organize your source data. Automate excel reports systems work best with well-structured, consistent data.
Ensure your data sources use consistent naming conventions, date formats, and data types. Proper preparation ensures automation becomes easier and more dependable.
Consider using Excel tables for your data sources. Tables automatically expand when new data is added and provide structured references that make formulas more readable and reliable.
Converting your data ranges to tables is one of the simplest steps toward automation.
Essential Excel Features for Automation
Excel provides several built-in features that make Automate Excel reports or automation possible without requiring advanced programming skills.
These tools form the backbone of most automate excel reports solutions and can handle many common reporting tasks.
Pivot Tables and Pivot Charts
Pivot tables are highly effective for quickly summarizing and analyzing big datasets. They automatically update when source data changes, making them perfect for automated reporting.
You can build dynamic summaries that update automatically as new data comes in, without needing manual effort.
To create an auto-refreshing pivot table, connect it to your data source using Excel’s Data Model.
This connection ensures the pivot table updates automatically when you add new data to your source table.
Formulas and Functions
Excel’s formula library includes powerful functions for data manipulation and calculation. Key functions for automation include VLOOKUP, INDEX/MATCH, SUMIFS, COUNTIFS, and various text functions.
These formulas can pull data from multiple sources and perform complex calculations automatically.
excel
=VLOOKUP(A2,DataTable[#All],3,FALSE)
=SUMIFS(SalesData[Amount],SalesData[Date],">"&B1,SalesData[Region],C1)
=INDEX(ProductList[ProductName],MATCH(D2,ProductList[ProductID],0))
Conditional Formatting
With conditional formatting, key data points are highlighted automatically according to set rules.
This feature helps create visually appealing reports that draw attention to key metrics and trends without manual formatting.
Advanced Automation Techniques
For more sophisticated automation in Automate excel Reports, Excel offers advanced features that can handle complex reporting requirements.
These techniques require more setup time initially but provide significant long-term benefits.
Excel Macros and VBA
Visual Basic for Applications (VBA) allows you to create custom automation scripts that can perform virtually any task within Excel.
Macros can automate complex sequences of actions, from data import to report generation and distribution.
vba
Sub AutomateReport()
    Dim ws As Worksheet
    Set ws = ThisWorkbook.Sheets("Report")

    ' Refresh all pivot tables
    ws.PivotTables("PivotTable1").RefreshTable

    ' Update chart data
    ws.ChartObjects("Chart1").Chart.Refresh

    ' Save and email report
    Call SaveAndEmailReport
End Sub
Power Query for Data Connection
Power Query enables you to connect Excel to various data sources, including databases, web services, and other Excel files.
This feature automatically imports and transforms data according to your specifications, creating a reliable data pipeline for your reports.
Excel Add-ins and Third-Party Tools
Various add-ins extend Excel’s automation capabilities.
Tools like Power BI, Tableau, and specialized Excel add-ins can enhance your automation of automate excel reports options and provide more sophisticated reporting features.
Step-by-Step Guide to Automate Excel Reports
Creating your first automated report requires careful planning and systematic implementation. Follow these steps to build a reliable automation system that meets your specific needs.
Step 1: Define Report Requirements
Start by clearly defining what your automated report needs to accomplish. Determine your data sources, the calculations needed, formatting styles, and how the report should be shared.
This planning phase prevents issues later in the automation process.
Step 2: Prepare Your Data Sources
Organize your data in a structured format that supports automation. Use consistent column headers, data types, and naming conventions.
Think about building a single data hub that can supply information to multiple reports.
Step 3: Build the Report Template
Set up a ready-to-use template that comes with built-in formatting, formulas, and structure.
This template serves as the foundation for your automated system and ensures consistent output every time.
Step 4: Implement Automation Features
Add the automation elements to your template. This might include pivot tables connected to your data source, formulas that calculate key metrics, and conditional formatting rules that highlight important information.
Step 5: Test and Refine
Thoroughly test your automated system with different data sets to ensure it works correctly. Check all calculations, verify formatting, and confirm that the automation handles edge cases appropriately.
Common Automation Scenarios and Solutions
Different industries and roles require various types of automated reports. Understanding common scenarios helps you adapt automation techniques to your specific needs.
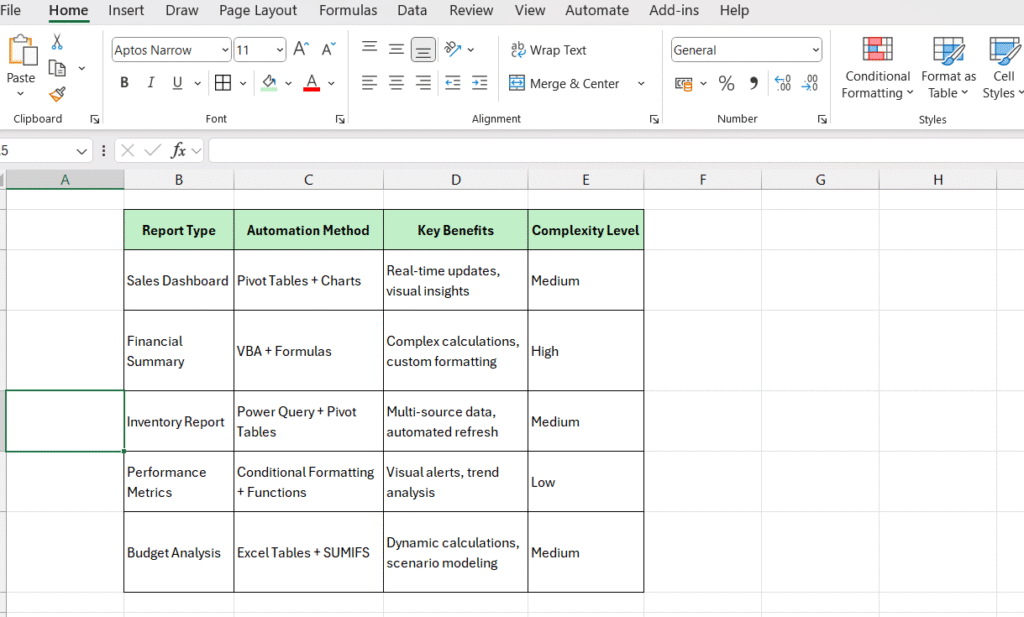
| Report Type | Automation Method | Key Benefits | Complexity Level |
|---|---|---|---|
| Sales Dashboard | Pivot Tables + Charts | Real-time updates, visual insights | Medium |
| Financial Summary | VBA + Formulas | Complex calculations, custom formatting | High |
| Inventory Report | Power Query + Pivot Tables | Multi-source data, automated refresh | Medium |
| Performance Metrics | Conditional Formatting + Functions | Visual alerts, trend analysis | Low |
| Budget Analysis | Excel Tables + SUMIFS | Dynamic calculations, scenario modeling | Medium |
Sales Reporting Automation
Sales teams benefit greatly from automated reporting systems. These reports typically pull data from CRM systems, calculate key performance indicators, and present results in easy-to-understand dashboards.
Automation ensures sales managers receive up-to-date information without waiting for manual report preparation.
Financial Reporting Automation
Finance departments handle complex calculations and multiple data sources. Automated financial reports can consolidate data from various systems, perform regulatory calculations, and generate standardized financial statements.
This automation ensures accuracy and compliance while reducing preparation time.
Operations and Inventory Reporting
Operations teams need real-time visibility into inventory levels, production metrics, and supply chain performance.
Automated reports can monitor these metrics continuously and alert managers when intervention is needed.
Best Practices for Excel Report Automation
Successful automation requires following established best practices that ensure reliability, maintainability, and scalability of your automated systems.
Data Validation and Error Handling
Implement robust data validation to catch errors before they affect your reports. Use Excel’s data validation features and create error-checking formulas that alert you to potential issues.
This proactive approach prevents incorrect information from reaching stakeholders.
Documentation and Maintenance
Document your automation processes thoroughly. Include information about data sources, calculation methods, and maintenance procedures.
Proper documentation makes it easier for team members to understand and manage your automated processes.
Regular maintenance ensures your automation continues working correctly as business requirements change.
Schedule periodic reviews to update formulas, refresh data connections, and optimize performance.
Version Control and Backup
Maintain version control for your automated reports to track changes and enable rollback if needed.
Create regular backups of both the automation files and the underlying data to prevent loss of critical business information.
Troubleshooting Common Automation Issues
Even well-designed automation systems can encounter problems. Understanding common issues and their solutions helps you maintain reliable automated reporting.
Data Source Problems
Data source issues are among the most common automation problems. These might include moved files, changed column names, or modified data formats.
To address these issues, build flexibility into your automation by using dynamic references and error handling.
Performance and Speed Issues
Large datasets and complex calculations can slow down automated reports. Optimize performance by limiting data ranges, using efficient formulas, and breaking complex reports into smaller components.
Consider the insights available at TechTellent.com for additional optimization strategies.
Compatibility and Sharing Issues
Different Excel versions and operating systems can cause compatibility problems.
Test your automated reports across different environments and use features supported by your target audience’s Excel versions.
Advanced Integration Options
Modern businesses often need to integrate Excel automation with other systems and platforms.
These integrations extend the capabilities of your automated reports and create more comprehensive business intelligence solutions.
Microsoft provides extensive resources for Excel integration through their official documentation, including APIs and development tools that enable seamless connections with other Microsoft Office products and third-party applications.
Cloud-Based Automation
Cloud platforms like Microsoft 365 enable automated reports to run independently of desktop computers.
These cloud-based systems can schedule report generation, automatically distribute results, and provide access from any device.
Database Integration
Connecting automated reports directly to databases ensures real-time data access and eliminates manual data export processes.
Excel’s native database connectivity features support most common database systems.
Measuring Automation Success
Track the success of your Excel report automation efforts by monitoring key metrics that demonstrate value and identify improvement opportunities.
Calculate time savings by comparing manual report creation time with automated processes.
Most organizations see 70-90% time reduction for routine reports when they successfully automate Excel reports.
Monitor error rates to ensure automation improves accuracy. Automated systems typically reduce errors by 80-95% compared to manual processes, but only when properly implemented and maintained.
Assess user satisfaction and adoption rates. Successful automation should make users’ jobs easier and provide more valuable insights.
Consistent feedback highlights improvement areas and reveals new chances for automation.
Helpful Excel Templates and Resources for Automation
To accelerate your Excel automation journey, consider using pre-built templates that can serve as starting points for your automated reporting systems. These templates provide structured frameworks that you can customize for your specific needs.
For beginners looking to build foundational Excel skills before diving into automation, the Excel for Beginners PDF guide offers comprehensive training materials that cover essential functions and features.
When working on financial reporting automation, specialized templates can significantly speed up your development process. The debt service coverage ratio formula template and profit margin formula Excel guide provide ready-made solutions for common financial calculations that you can integrate into your automated systems.
For sales and business reporting, consider utilizing templates like the monthly sales report template which includes pre-built formulas and formatting that can be easily automated. Similarly, the real estate CRM Excel template demonstrates how industry-specific automation can streamline complex data management tasks.
Project management and planning automation can benefit from structured templates such as the Google Sheets product roadmap template, which shows how similar automation principles apply across different spreadsheet platforms.
For businesses managing complex financial structures, the debt schedule template provides an example of how automated calculations can handle intricate financial modeling. Additionally, the RFI template Excel guide demonstrates how automation can streamline document management and request processing workflows.
Future of Excel Report Automation
Excel continues evolving with new features that enhance automation capabilities.
Artificial intelligence integration, improved data connectivity, and enhanced visualization options are making it easier than ever to automate Excel reports effectively.
Stay informed about new Excel features and automation tools that can improve your reporting processes.
The investment in learning these new capabilities pays dividends through increased efficiency and better business insights.
When you automate Excel reports, you transform from a data processor into a data analyst.
This shift enables you to focus on interpreting results, identifying trends, and making strategic recommendations rather than spending time on repetitive tasks.
Start your automation journey today by identifying one repetitive report that consumes significant time.
Apply the techniques outlined in this guide to create your first automated system, then gradually expand automation to other reports.
The initial time investment will pay substantial dividends through improved efficiency and accuracy in all your future reporting efforts.
Frequently Asked Questions – Excel Report Automation
How long does it take to automate Excel reports?
The time required depends on report complexity. Simple reports with basic formulas and pivot tables can be automated in 2-4 hours. Complex reports involving VBA macros, multiple data sources, and advanced calculations may take 1-2 days initially. However, this upfront investment saves hours every week once implemented.
Do I need programming skills to automate Excel reports?
No, you don’t need advanced programming skills. Basic automation can be achieved using Excel’s built-in features like pivot tables, formulas, and conditional formatting. For advanced automation, learning basic VBA is helpful but not mandatory. Many automation tasks can be accomplished with Excel’s native tools.
Can automated Excel reports work with data from different sources?
Yes, Excel supports various data sources including CSV files, databases, web APIs, and other Excel files. Power Query is particularly useful for connecting multiple data sources and automatically refreshing your reports when source data updates.
What happens if my data source structure changes?
Well-designed automated reports can handle minor structural changes. Use dynamic ranges, Excel tables, and structured references to make your automation more flexible. For major structural changes, you may need to update formulas and connections, but this is typically a one-time adjustment.
How do I share automated Excel reports with my team?
You can share automated reports through several methods: save them to shared network drives, use cloud storage like OneDrive or SharePoint, or set up automatic email distribution using VBA macros. Choose the method that best fits your organization’s infrastructure and security requirements.
Are automated Excel reports secure?
Excel offers several security features including password protection, worksheet protection, and VBA code protection. For sensitive data, consider additional measures like file encryption and controlled access permissions. Always follow your organization’s data security policies.
Can I schedule automated reports to run automatically?
Yes, you can schedule reports using Windows Task Scheduler to open Excel files at specific times, or use Excel’s built-in features in Microsoft 365. VBA macros can also include timing functions for automatic execution.
What’s the difference between Excel automation and using BI tools like Power BI?
Excel automation is ideal for smaller datasets, departmental reporting, and when you need detailed control over formatting. BI tools like Power BI are better for large datasets, real-time dashboards, and organization-wide reporting. Many businesses use both tools for different purposes.
How do I troubleshoot broken automated reports?
Common issues include missing data sources, changed file paths, or updated data formats. Start by checking data connections, verifying file locations, and testing formulas with sample data. Keep backups of working versions and document your automation setup for easier troubleshooting.
Can automated Excel reports handle large datasets?
Excel can handle up to 1 million rows, but performance may slow with very large datasets. For better performance with large data, consider using Power Query for data processing, optimize your formulas, and break complex reports into smaller components. For datasets exceeding Excel’s limits, consider database solutions.
Is it worth automating reports that I only create monthly?
Even monthly reports benefit from automation if they involve complex calculations or multiple data sources. The time saved on formatting, formula creation, and error checking often justifies automation. Plus, automated reports ensure consistency and reduce the risk of mistakes.
How do I maintain automated Excel reports over time?
Regular maintenance includes checking data connections, updating formulas for business changes, and testing reports with new data. Create a maintenance schedule, document all automation components, and train backup team members to handle updates when needed.